

Network Topology
Here's a snapshot of an ongoing project to develop near real-time topological displays for situational awareness. We use argus data, MySQL, the Thinkmap SDK, AS numbers and country codes derived from our geolocation support, to build topologies for Network Entity Social Networking Analysis.
The concept is that we have light weight active agents that are looking at the IP address tables that we maintain, and periodically trace-route to the remote networks we see. We don't bother to collect the path information from the active agents, as the path data is collected in our argus archive (because we have sensors deployed that captures the traceroute traffic). We collect the path information periodically from the primitive data archive, using rapath(), and use the data to maintain a path database in MySQL.
The path information, provides us with the interior nodes and their Round Trip Times, so we get a metric for distance for our topology. The Thinkmap SDK provides us with really nice graphics, and an object model that provides graphical support for our IP address attributes, such as AS number. We use their edge length feature to keep nodes at RTT distance away, and also use their magnet mechanisms to get the routers that are in the same AS to clump together. We're also using their MultiCenter support, which allows us to position the router where we want on the map.
Graph Data Generation
So the basic data needed for this specific graph comes from IP Matrix data that we can create from the rapath() information we collect. We look for rapath() data for traceroutes to DNS root servers, and we generate all the "Inode" IP addresses for each Router. From this list, we use the geolocation database to give us an AS number for each router. At this point we have the ability to generate an entity table that contains entries like:
<node type="ROUTER" id="207.172.19.100" >
<property name="iAS" value="6079" />
<property name="Domain" value="tge1-3.core1.nyw.ny.rcn.net" />
<property name="MinDur" value="0.006799" />
<property name="AvgDur" value="0.065243" />
</node>
From the path data we generate edge descriptions like:
<edge type="ROUTER_ROUTER" fromid="128.8.0.237" toid="131.118.255.214" > <property name="owd" value="1.255"/>
"owd" refers to the one-way delay between the two machines. And again, voilà!!!!! Here is our interactive Java screen after playing with the layout for 30-45 seconds.
Resulting Image
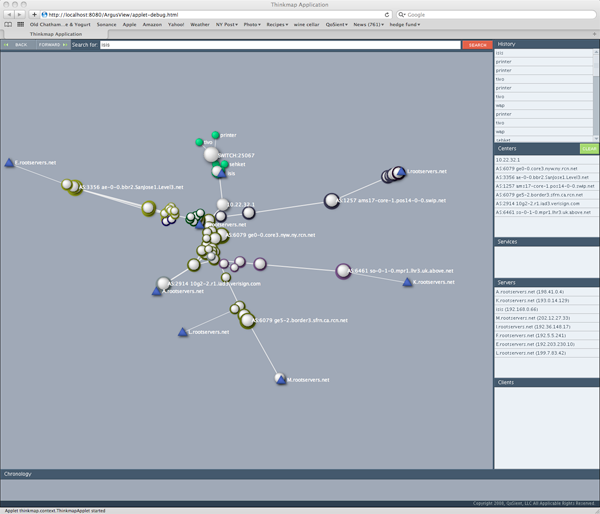
Generating static images of topologies can be accomplished using Open Source graphing systems like AfterGlow. The effort here is to generate real-time situational awareness screens, that can be manipulated and queried for data-mining. We're working with the Thinkmap SDK to try to give us that. If you find this interesting, please send email.
Currently, we're working on the MySQL side so that the Thinkmap can access the topology data in real-time.