Application Demand Reporting
Graphing the offered load or rate of a given flow is very useful for reporting and visualizing the behavior of an application. Argus provides a great deal of flexibility in reporting and graphing flow data, but the data can also be used by other programs, like Excel and Mathmatica.
In this series of graphs, we are plotting the average bandwidth reported in each of the
5 second status reports that argus generated for a specific iTunes based Internet radio
stream, that last for an entire day. We are plotting the data as a histogram, or a
frequency distribution, so you can see the variation of the demand over the lifetime of
stream. This is extremely useful when characterizing the network resources needed to support
a given application, but it also gives a great indication of the performance of the network
during the day. For applications like video and voice/sound distribution, the streams
should maintain a pretty constant load, and watching the changes can give some insight into
the customers quality of experience, without having to ask the user.
Graph Data Generation
We use ra() or rasql() to select the data for our study from a daily archive. For this study we know which destination IP address is the Internet radio server, so we don't really need to know what protocol/port is being used, we just gather all the flow records going to any Radio Paradise server at our external boundary for a day that was good, and a day that was bad.
ra -R /path/to/my/archive/207.237.36.98/2006/07/31 -w /tmp/dataset.file.good - net xxx.yyy.0.0/16
ra -R /path/to/my/archive/207.237.36.98/2006/08/27 -w /tmp/dataset.file.bad - net xxx.yyy.0.0/16
We'll process these two files using rahisto() to generate the histograms of the destination rate of all the flow records we see.
What this will give us is the statistical distribution of the network demand for each 5 second period the streams were active.
Well use a low-pass and high-pass filter to make sure that we're getting data that is relevant to the audio stream. While this may seem like a way to skew our data, it really is using the methods we use to find audio streams in the first place, so not a big deal here.
rahisto -r /tmp/dataset.file.good -H drate 140:100-170K -c ',' > rahisto.good.output
rahisto -r /tmp/dataset.file.bad -H drate 140:100-170K -c ',' > rahisto.bad.output
From here we use one of our common graphing tools, Excel, to graph all the data that we get.
Resulting Graphs
 |
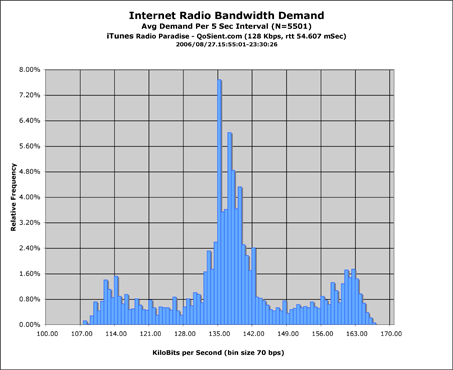 |
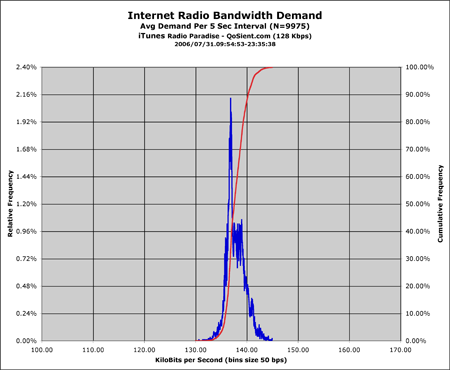
The first graph is what the application looks like on a good day. The second graph is the same radio channel, same workstation, but on a bad day for easy listening. The primary difference between the two graphs, is a broadening of the data set, which indicates that there is variance in observed bandwidth. This is an indication of periods of loss (bandwidth goes down) and the subsequent retransmission needed to suppport TCP's reliable data transport (the bandwidth goes up). The practical relevance of this is when the bandwidth dips below 115-116Kbps in this type of audio transmission, there is a high likelyhood that there will be breakup in the audio. Not good.
These two graph types are very common in signal processing. The first graph is a line graph of two metrics that rahisto() provides, the first in dark blue is the Relative Frequency of the bandwidth demand of Internet Radio flows, the second in red, is the Accumulated Frequency, which goes from 0-100%. This red line is used to indicate if there are multiple populations of data, and in this case there are not.
The second graph is just a bar graph of the Relative Frequency, which is the most common graph you will see. (A lot of people don't do much with the Accumulated Frequency, so they just leave it out).
The statistics around these types of frequency distributions are pretty straight forward and the subject of many books.
OK, graph generated using Microsoft Excel, data generated by argus(), and rahisto().