Visualization
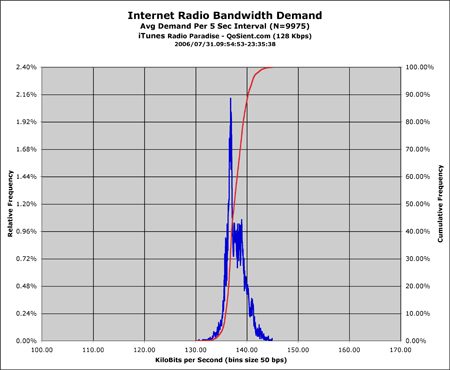
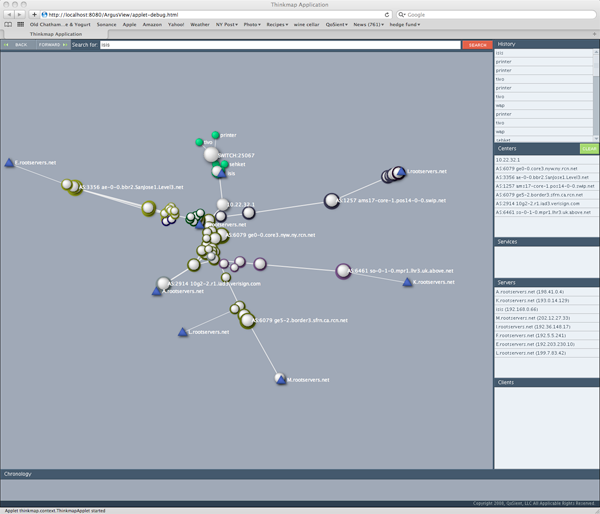
There are a lot of topics to present here. These images are links to efforts that use argus data for visualization. Some are references to other web-sites and other projects, so you may wind up somewhere else in the Internet, but hopefully you will find it interesting. Not all of the references are to "active" projects, but as long as the links are working, all do refer to code that is available for implemenation, or are descriptive enough to provide a good example as to what/how people are visualization argus data.
This page is in no way "complete", and more work is coming in the next months. But, please send any suggestions for additional images, and HOW-TO's for graphing and do send any links that have visualizations that you created using argus data.
Each of the pages should be somewhat descriptive.
Page Last Modified: 14:22:39 EDT 13 Mar 2012 ©Copyright 2000 - 2012 QoSient, LLC. All Rights Reserved.


